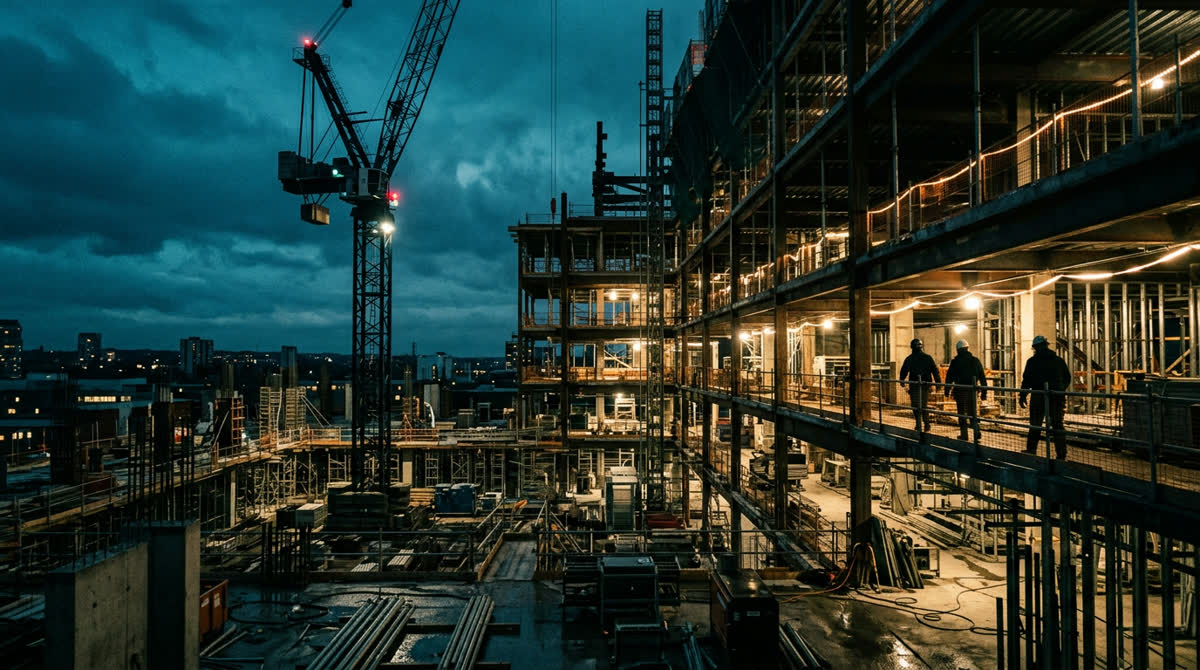
Construction
Project cost, physical-financial schedule and budget variance. The overrun is almost always visible months in advance to whoever is looking.
Talk to a specialistA budget overrun is rarely a surprise. It is a late discovery.
A construction site generates information at a different rhythm from the one management consumes. The site log is filled in on site, measurements come by stage, the supplier invoice arrives later and finance consolidates at closing. By the time the variance shows in the report, it happened weeks ago.
The problem is not lack of control: it is lag. The data exists, but it arrives too late and too fragmented to support the decision there would still be time to take.
The questions we answer
- Which project is drifting from budget, at which stage and through which material?
- Does physical progress match financial progress, or are we paying ahead?
- Which supplier delivers on the agreed date and which pushes the schedule?
- What is the real cost per square metre, comparable across projects?
- How long passes between a cost being incurred and it appearing in the report?
The indicators of this industry
The ones that show up in most projects in this industry. The final set is always agreed with you an indicator nobody uses is dead weight on a dashboard.
- Budget. Budget variance by project, stage and material, incurred versus budgeted cost, cost S-curve, cost per square metre comparable across projects.
- Schedule. Physical versus financial progress, schedule adherence, delay by stage, crew productivity by trade.
- Procurement. Delivery time by supplier, material price variance, material turnover on site, loss and waste by material.
- Management. Lag between a cost and its visibility, pending measurements, change orders per project, result per project across the portfolio.
The solutions we use most here
- Business Intelligence. Budget versus actual by stage, with physical and financial side by side.
- Integration & AI Automation. Reducing the lag: field reporting coming in without passing through a spreadsheet.
- Data Governance. A standardised cost structure, so different projects become comparable.
How we run it
We start with the cost structure: without a standardised classification, different projects do not compare and the indicator does not scale. Then we attack the lag, shortening the path between a cost happening and it appearing that is what turns the report into a correction tool rather than an autopsy. Dashboards by role come later: engineering sees the stage, leadership sees the project portfolio.
How we measure results
The most frequent indicators are reduction in budget variance, days between a cost and its visibility, physical-financial schedule adherence and comparable cost per square metre.
We now have a far more robust, fast and visual view of each management area’s results.
Sales director national fuel distributor
About this industry
Our site log is filled in on paper.
It is the common scenario, and the biggest cause of lag. The first improvement is usually replacing paper with a simple form on the foreman’s phone and that alone shortens the time until the data appears considerably.
Each project has a different cost structure. Can they be compared?
Only after standardising, and that is the first deliverable. Different structures do not compare, which is why "cost per square metre" is usually a number nobody defends. We standardise the classification and the indicator starts to make sense across projects.
Does it integrate with our construction ERP?
Yes. Sector-specific ERP, measurement spreadsheets and field reporting all come in as sources. Where there is no API, we extract another way.
How long until the first result?
A little longer than in other sectors: four to eight weeks, because standardising the cost structure comes before the dashboard. The initial assessment, with the lag map, comes in the first week.
Do your projects warn you before they overrun?
Thirty minutes of conversation is usually enough to see where the lag sits.
We understand processes before recommending technology. Automation, data, artificial intelligence, and custom software for companies seeking efficiency, control, and scale.